Continuing the saga of utilizing Advanced Geochemistry Technology (AGT) to piece together the puzzle of oil mixture composition and confirm the origin of the deep hydrocarbon charges in the oil mixtures of the Santos and Sergipe-Alagoas Basin, this week we are taking a deeper look at Quantitative Extended Diamondoid Analysis (QEDA), Biomarker Technologies’ proprietary AGT in partnership with BPS.
How would you like to understand petroleum systems in a completely new way by studying diamonds? And what if we were to tell you that by studying diamonds that you could create better and more accurate basin models revealing new plays in even the most explored basins? And what if you could tell everyone you met at a cocktail party that you are studying diamonds and at the same time you are creating new exploration opportunities for your company? Well, if the idea appeals to you (and why wouldn’t it), QEDA is for you.
It turns out that very small diamonds can be found dissolved in every crude oil. These diamonds, known as diamondoids, are indeed very minute. They are in the order of a billion billionth of a carat and if you had a teaspoon full, you could give billions of them to every person on earth. What a gift, eh?
As said, these nanometer-size diamonds can be found in every oil and condensate. And since they are actually diamonds, albeit very small ones, they are more stable for their size than any other molecule in petroleum. This makes them the ideal molecules to study petroleum origins and thermal evolution.
Even though they are very small, they occur in a wide variety of shapes and sizes, as discussed below. These shapes range from rod-shaped diamonds to pyramid-shaped diamonds, to diamonds that look like hockey pucks (Fig. 1). And it turns out that some source rocks like to make pyramids, some prefer to make rods and some would rather make hockey pucks. This is the basis of QEDA, i.e. determining the source of any oil or condensate by the ratios of diamonds (diamondoids) of different shapes and sizes.
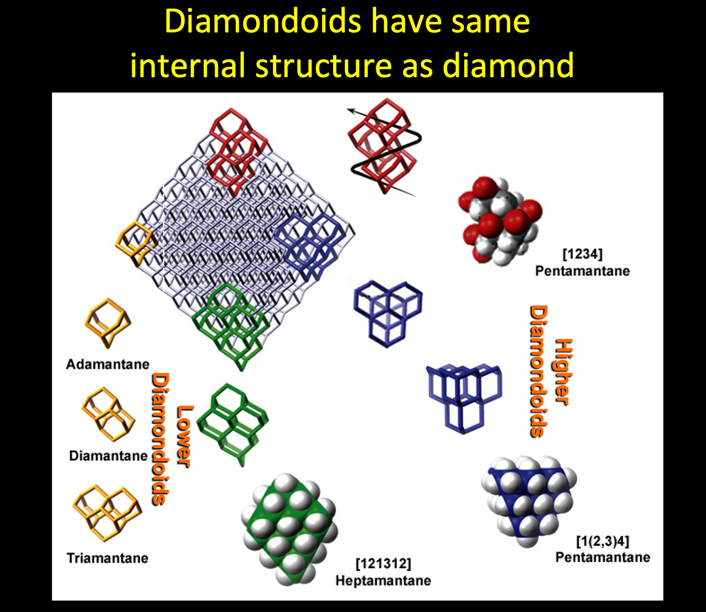
Diamondoids are basically molecular-sized diamonds. The unit-cell of diamond is a diamondoid. Another way to look at it is that if one were to begin crushing a large diamond, the smallest pieces one could obtain that would still have the diamond cage structure would be diamondoids. Alternatively, since diamond is made up of carbon cages built from cyclohexane rings, one could construct a large diamond by fusing together a tremendous number of diamondoid cages. In fact, as part of our current research, we are currently using diamondoids as seeds to grow larger diamondoids using chemical vapor deposition (CVD).
A diamondoid consisting of a single cage is known as adamantane. Two cages is diamantane, three is triamantane, four is tetramantane, etc. Adamantane, diamantane and triamantane comprise the “lower diamondoids”. Lower diamondoids have no structural isomers and they can be relatively easily synthesized. “Higher Diamondoids” consist of diamondoids with four or more fused cages. These are the tetramantanes, pentamantanes, hexamantanes, heptamantanes, etc (Fig. 1). Higher diamondoids have structural isomers and even condensed forms in which hydrogens are eliminated due to increasing amounts of overlapping cages within the structure. There are three tetramantane isomers, nine pentamantane isomers (three of these isomers are enantiomeric), and thirty-six hexamantane isomers, including one condensed structure known as cyclohexamantane (Dahl et al., 2003; Dahl et al., 2003b). Besides having isomers, higher diamondoids are very difficult to synthesize. Until 2003, only one tetramantane isomer had been known to exist, although others had been postulated. In 2003, a wide variety of higher diamondoids up to 11 cages were isolated from petroleum and their structures proven (Dahl et al., 2003).
Although diamondoids are diamonds, they are also hydrocarbons. The formula for adamantane is C10H16. Large diamonds also have hydrogen atoms which terminate dangling bonds on their surface, although the ratio of surface to bulk is extremely small in bulk diamond since most of the carbons are internal and bonded to four other carbons. However, the smaller the diamond, the larger the surface to bulk ratio, and if the diamond is small enough, there is more diamond surface than bulk internal diamond. As a result, if the diamond is small enough, as is the case with diamondoids, there can actually be more hydrogen atoms terminating dangling surface carbon bonds than carbon atoms in the structure.
Small diamonds, in this case diamondoids, retain many of the properties of diamond due their interlocking cage structure. For example, both are extremely stable and have similar unique electronic properties (Yang et al., 2006; Clay et al., 2009). In terms of geochemical applications, it is the thermal stability of diamondoids compared to the rest of the petroleum which has tremendous use (Dahl et al., 1999).
Diamondoids are not as stable as larger diamonds due to the fact that stripping hydrogen atoms from the surface of large diamonds does basically nothing to the internal structure, while extracting a hydrogen from the surface of a diamondoid can cause collapse of the internal structure. Hydrogen extraction is facilitated by the presence of metal, and as a result, it is presumed that diamondoids in petroleum reservoirs are probably more stable than in laboratory heating experiments. We have shown that diamondoids are stable to vitrininte reflectances greater than 4.0 and we are currently studying whether they are present in metamorphic rocks. In any event, unalkylated diamondoids are not cracked at maturities generally reached in conventional petroleum systems.
The Method
Just as biomarker isomer and homolog ratios are used to determine oil families, one can use higher (or extended) diamondoid isomers to determine oil families in exactly the same way. Although it might be possible to correlate oils using the lower diamondoids adamantane, diamantane and triamantane, there are inherent problems due to the difference in volatility between the C10 adamantane, the C14 diamantane and the C18 triamantane. Preferential evaporation during production or sampling is an obvious problem. Another problem is gas solubility, as adamantane is more soluble than diamantine, which is more soluble than triamantane.
To circumvent the problem of volatility differences between adamantane, diamantane and triamantane, people have tried using ratios of alkylated diamondoids for both source (Schulz et al., 2001) and maturity (Chen et al., 1996). Unfortunately, biomarker alkylation is dependent on both maturity and source, so determination of either maturity or source using alkylated diamondoids is ambiguous.
To solve these pitfalls, we developed a method of oil correlation using unalkylated higher diamondoid isomers to determine source. In particular, we use the three tetramantane isomers, which we call Tetra 1, Tetra 2 and Tetra 3, or T1, T2 and T3 based on their GC elution order. In addition, we use four pentamantane isomers, P1, P2, P3 and P4, and the single condensed hexamantane isomer cyclohexamantane. For precision and accuracy in our analyses of these higher diamondoid isomers, we have synthesized a deuterated version of each. Using accurate concentration numbers for each isomer, we are then able to construct plots including line diagrams and ternary plots using any combination of the higher diamondoids analyzed.
Originally, we observed empirically that different oil families had different higher diamondoid distributions, but we did not understand why. Therefore, we performed a series of hydrous pyrolyses using different organic molecule precursors and different mineral assemblages to generate higher diamondoids. First of all, pyrolyses with no clay minerals generated no diamondoids. Pyrolyses using the same organic precursors over different mineral assemblages containing clays generated different QEDA signatures. In addition, pyrolyses over the same mineral assemblages using different organic precursors generated different QEDA patterns. These experiments show that source rock mineralogy and source rock organic precursors determine the distribution of higher diamondoid isomers, i.e. the QEDA in an oil. This in turn allows QEDA to be used to determine oil source families and facies variations within those families.
Higher diamondoid, QEDA, oil correlations have many advantages over biomarker correlations. Perhaps the most obvious is that they can be used to correlate any oil or condensate no matter the maturity. As such, it is possible to correlate a low-maturity oil to a condensate from a dry gas field. An example we have shown is from the Smackover Formation oil family, where it is possible using QEDA to correlate the low-maturity onshore Toxey Oil to condensates from the dry gas fields of Mobile Bay. Furthermore, in a mixed-source oil, which most oils seem to be, it is possible to determine the source of the most mature component. This is because diamondoid concentrations are elevated in cracked oils and therefore the majority of the diamondoids in a mixed-source oil will be from the more mature component. Therefore, as previously stated, determining the shallow, less-mature source using biomarkers and biomarker isotopes together with determination of the deep source using QEDA gives a clear picture of the origin of an oil. An estimation of the relative charge from each using diamondoid concentrations then gives a full picture of an oil that can be used to calibrate computational basin models.
Another advantage of QEDA correlations is that the isomers we use to do QEDA have no alkylation. As such, they are extremely stable, and although certain isomers are thermodynamically more stable than others, all the isomers used for QEDA are stable well in excess of the dry-gas window. As a result, QEDA distributions are purely source-related and have no maturity relationships whatsoever.
Although causes for biomarker ratios, e.g. the ratio of C29 to C30 hopane, have been well-studied as they have been around for 20 years or so, QEDA ratios have not. However, early studies suggest that there are reasons for differing ratios. For example, it appears that an unusual abundance of P3 (the linear-shaped pentamantane) compared to the other pentamantanes indicates a hypersaline source. Certainly, much research needs to be done in this field.
There are fundamental differences in biomarker correlations and diamondoid QEDA correlations. They stem from the fact that when you correlate an oil using biomarkers you are only looking at a relatively small and well-constrained part of the source rock (generally that in the early to mid-oil window where the biomarkers are most prevalent). This tends to make the interpretation relatively simple and straightforward. However, the answer is incomplete since many of the sources and source facies sourcing an oil are completely invisible to biomarker correlations. This is due to low concentrations and the strong overprinting by the least-mature oil source section. And this is true even if the charge from the least mature part of the source makes up only a small percent of the total charge. For example, for oils analyzed in the Sergipe-Alagoas Basin, although the biomarkers suggest many have a low-maturity marine source, it is clear from diamondoid analysis that in these “marine oils” only a small percentage of the charge is actually marine. By far the majority of the charge is lacustrine from below. The lacustrine biomarkers are basically invisible where present due to the much greater concentration of biomarkers in the marine source due to its lower maturity.
When one does oil correlations using QEDA, one sees ALL the source rocks and ALL the different facies represented in proportions based on relative charge contributions regardless of thermal maturity. Although this makes for a much more accurate determination of oil sourcing than biomarkers, the correlations can be more complicated and difficult to interpret than biomarker plots. With QEDA, one is no longer looking at a relatively thin slice of the geologic section (the part in the least-mature portion of the oil window) that may or may not represent the oils true source. Instead one is looking at the true source, i.e. everything from the top of the oil window down to the extremely mature source rocks all mixed together. Although QEDA interpretations may be difficult, it is still possible to interpret QEDA results in most cases, especially if end-member oils from each source are available.
