BPS has a long track record in the integration of all available data via a holistic petroleum system-related approach. In fact, this is something we pride ourselves on, constantly striving to provide our clients with the most complete picture of Brazilian petroleum systems on the market.
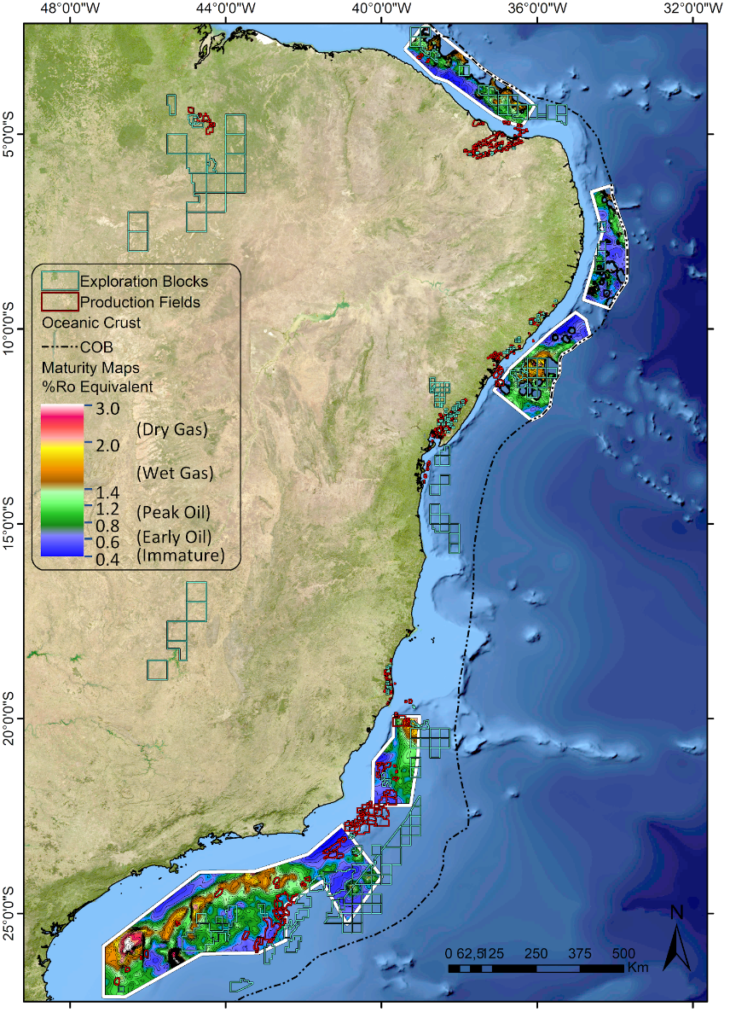
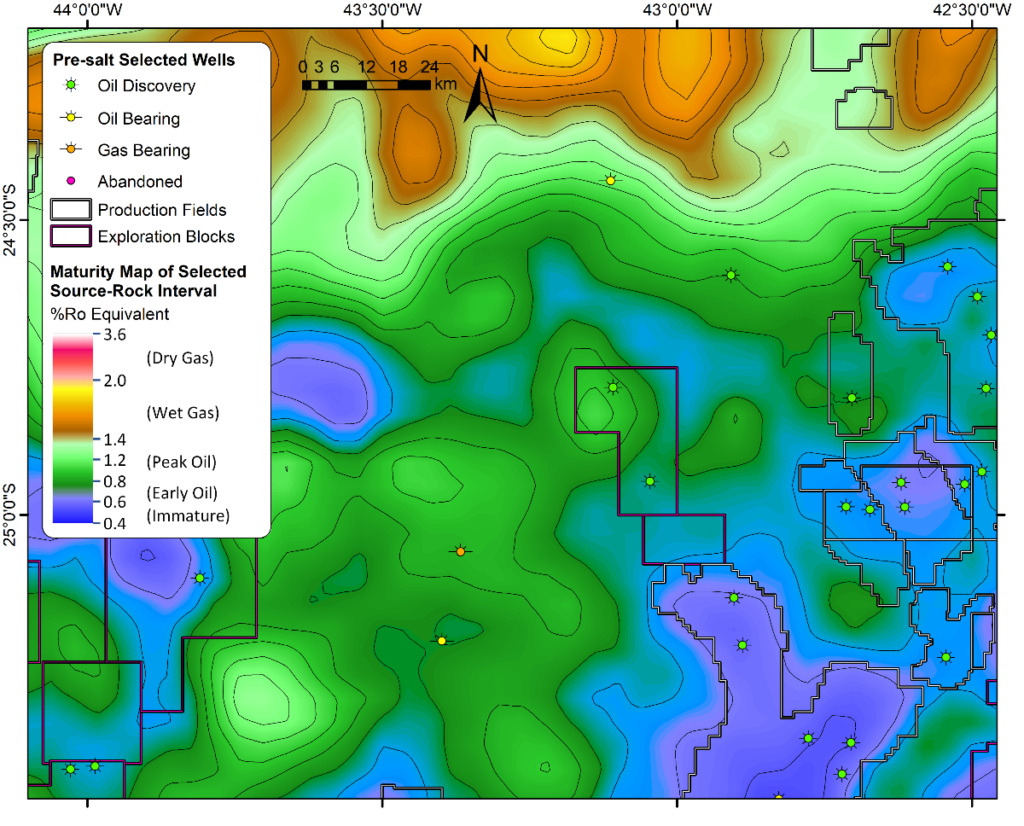
After years of building 2D and 3D petroleum system studies of onshore and offshore Brazil, we are excited to announce we are now making the non-confidential portions of these offshore studies available in the BPS Geodatabase via compiled maps of hydrocarbon maturity (%Ro) derived from the basin modeling (Figures 1 and 2). Please note the onshore maturity modeling products are slated for incorporation at a later date. And remember, this is just the first step in inserting all available information obtained from the petroleum system elements and processes of Brazilian basins into the BPS Geodatabase. We still have way more in the pipeline for this year and next!
The maturity maps offer one of the most important pictures of petroleum systems studies and are based on the regional heat flow interpreted from crustal models and structural and stratigraphic basin evolution, all calibrated with the outcomes of our proprietary Advanced Geochemistry Technology (AGT). Quantitative Diamondoid Analyses (QDA), for example, in conjunction with maturity maps, can indicate areas with low and high hydrocarbon cracking, migration constraints when compared to the potential generative pods, and oil mixing when it exists. With the functionality of correlating maturity maps with the basement framework and the integration with petroleum system modeling, the BPS Geodatabase is creating a new practical way to quickly evaluate charge from source to trap within the most important Brazilian basins.
Check out some examples below!