
Petroleum Systems Modeling (PSM) has developed from a niche technology in oil and gas exploration to a widely used application within little more than a decade. Today, almost all exploration projects worldwide must have the “PSM box checked” prior to any further decisions being taken. Why is this so?
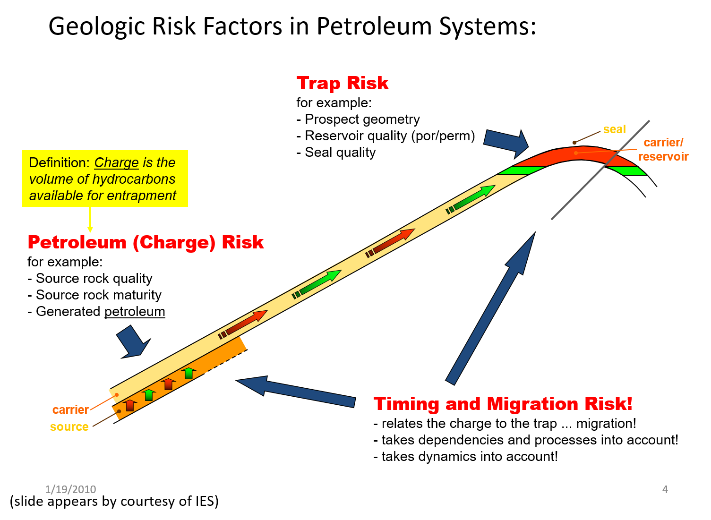
Figure 1: Schematic elements of a petroleum system.
Enter PSM: Only PSM can put all these loose ends together and connect all knowledge into a comprehensive picture of the dynamic, multi-variable petroleum system over time (Fig. 2). Hence, a full 3D petroleum systems model actually comprises four dimensions, with time being added as the fourth dimension. A model thus can incorporate the full geo-history of an entire basin, or of parts thereof, including the dynamics of the petroleum systems (hopefully) being present within that basin.
Of course, depending on the available database, a myriad of assumptions must be made prior to any simulation, most of which will be inaccurate or plainly wrong in the first place. But then there is the next twist of PSM: Using probabilistic methods, and multi-scenario approaches (simulation of “end-member scenarios”, and “What if” approaches), PSM allows for testing sensitivities, analyzing the behavior of the system, and identifying risks of the petroleum system under scrutiny, thus constraining our conclusions, and helping to steer exploration decisions. See figure 2 below: schematic display of what is covered by PSM.
HRT and BPS understood the potential of PSM for exploration very early on, first applying it to the Brazilian offshore basins in the early 2000s. No surprise he was also the first company to rigorously use PSM offshore Namibia. Starting in 2008, a large array of models was built and used to (1) understand the petroleum systems in the area, including their lateral variability, (2) identify risks, and (3) contribute to decision-making during exploration. Apart from two initial projects (a multi-1D, and a multi-2D project), a super-regional 3D model was built and analyzed covering the entire Namibian offshore region (FIG. 3). Due to the prevailing lack of data back then, this model was used as a broad, first-hand approximation of basin screening. Nevertheless, it allowed for many conclusions, e.g., concerning the likely timing and present-day degree of maturation in the diverse potential source rock intervals. Modeling the diverse sedimentation and burial histories in the different basins offshore Namibia enabled the team to pick the sweet spots in each basin.
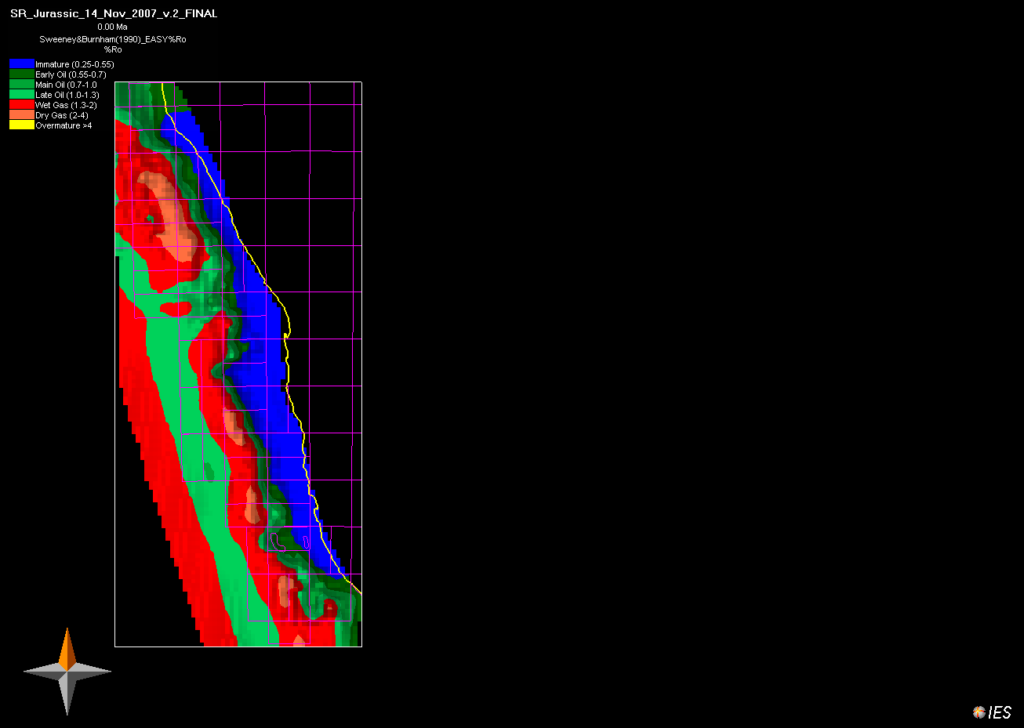


Fig. 3: First-hand approximated results of the super-regional model: Simulated present-day maturity (%Ro) of three selected potential source rock intervals. Left: potential source rock interval in the syn-rift sequence, or older; center: potential source rock interval of Barremian age (“Kudu Shale”?); right: potential source rock interval of Albian age. Red: gas window; green: oil window; blue: immature.
As exploration continued, and more, and better-quality data became available, zoomed-in models were built and analyzed, e.g., covering exploration blocks in the Orange Basin, close to the Kudu gas field (Fig: 4). This is the same area that would witness the spectacular discoveries made by Total and Shell in 2022.
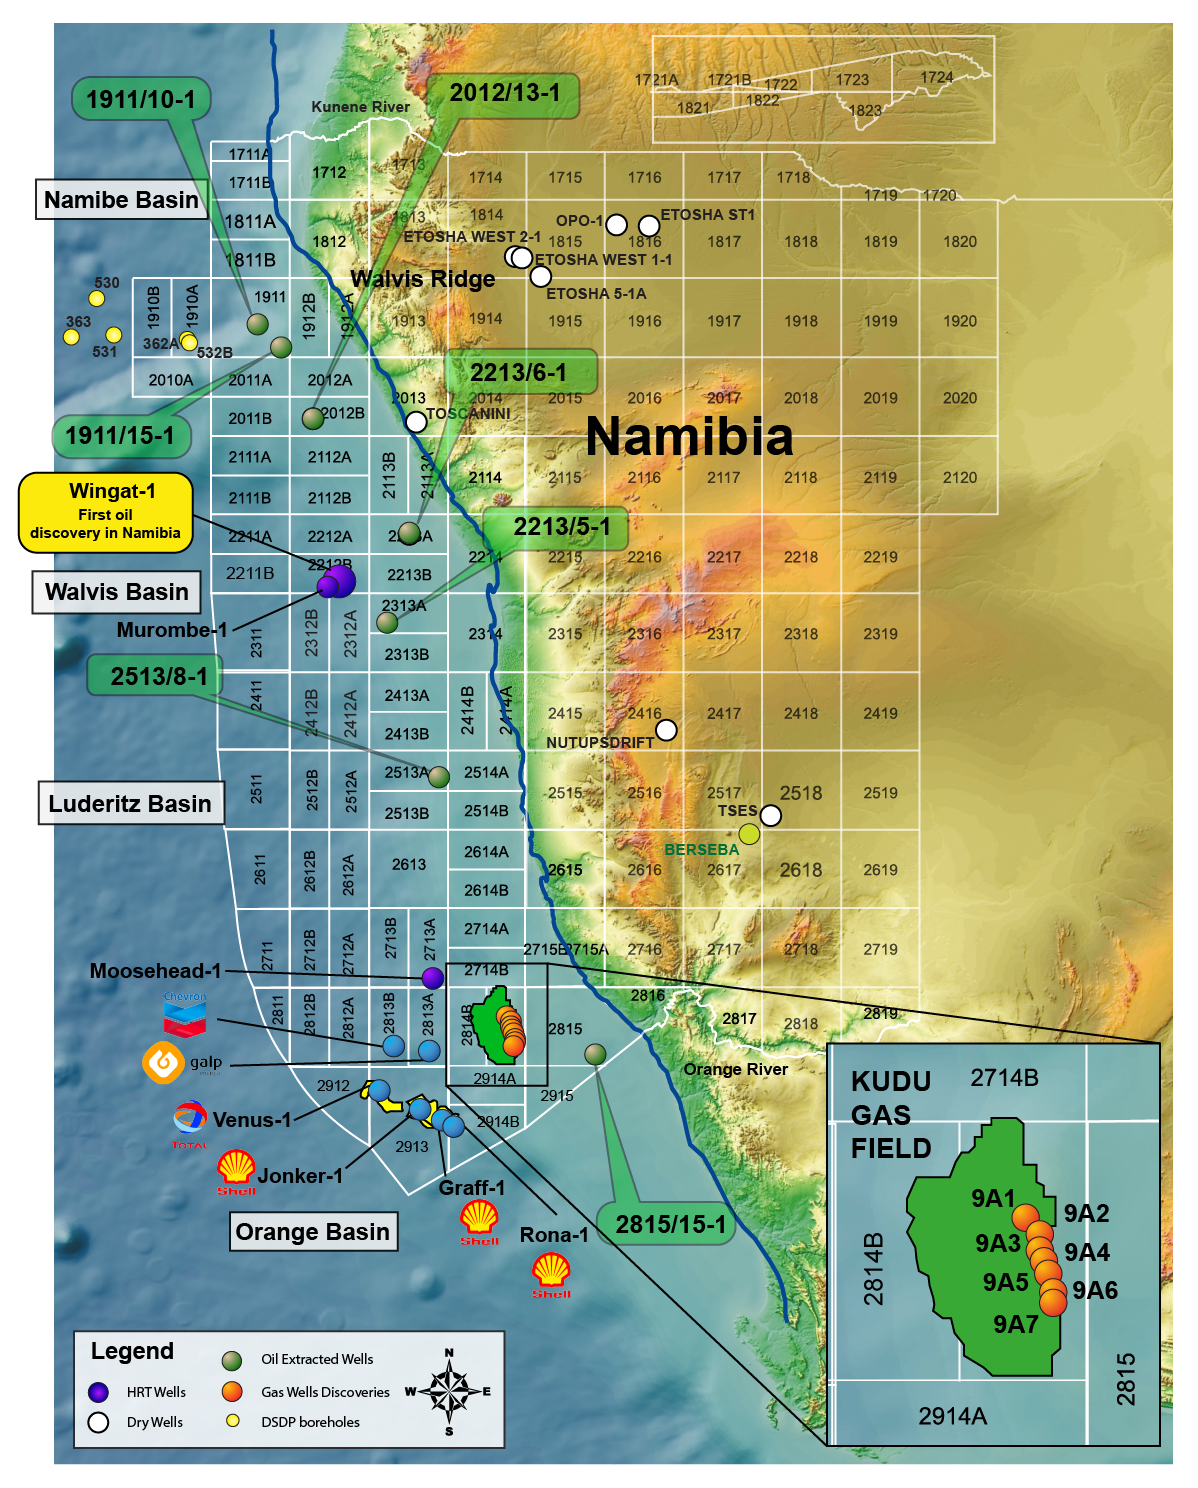
Fig. 4: Map of the southern Namibian Orange Basin with well locations.
One of the 3D models is shown in a 3D view in Fig 5. The 3D models were successfully calibrated not only to all available well data (e.g., temperature, pressure, porosity at the Kudu field), but also to the Kudu gas accumulation (Fig. 6).
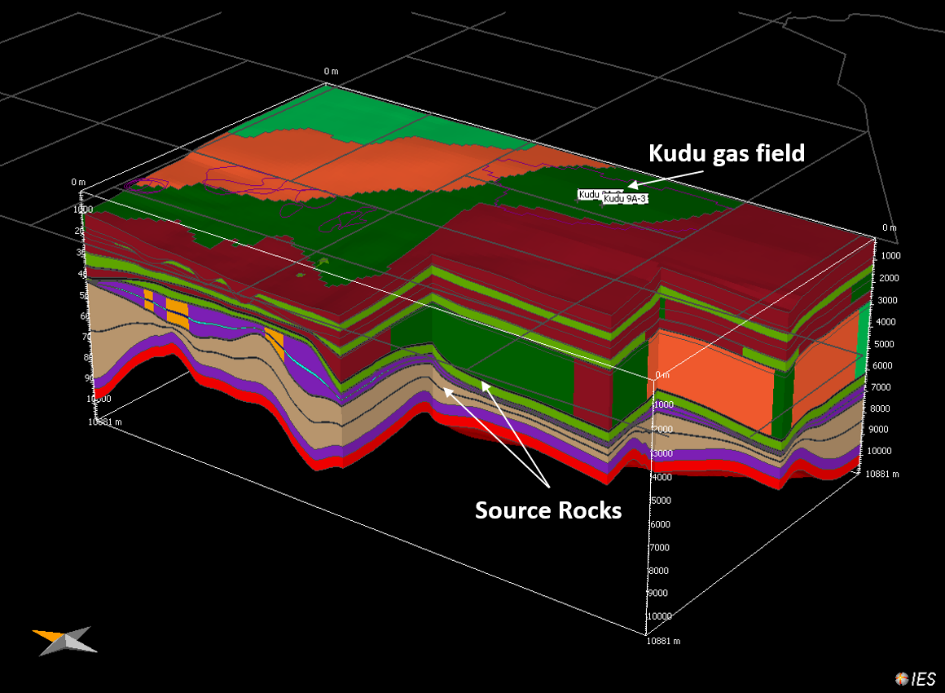
Fig. 5: 3D view from southwest of the 3D model covering the Kudu gas field and the area north of it.

Fig. 6: Results of migration simulations. The Kudu gas field is successfully reproduced in the model (red bodies to the right). Red bodies: vapor accumulations; green bodies: liquid accumulations.
What’s more, in a case of serendipity concerning the reality check of a model, also gas chimneys and hydrocarbons seeps/slicks were plausibly reflected by this model (FIG. 7). This only came to our attention when the modeling campaign was already done! In conclusion, the timing of maturation of source rocks, and their charge potential, as well as patterns of migration and entrapment in the area were deemed to allow for well-constrained predictions. However, the Moosehead well came out dry in reality, albeit this precise location was not predicted to carry an accumulation in this particular model.
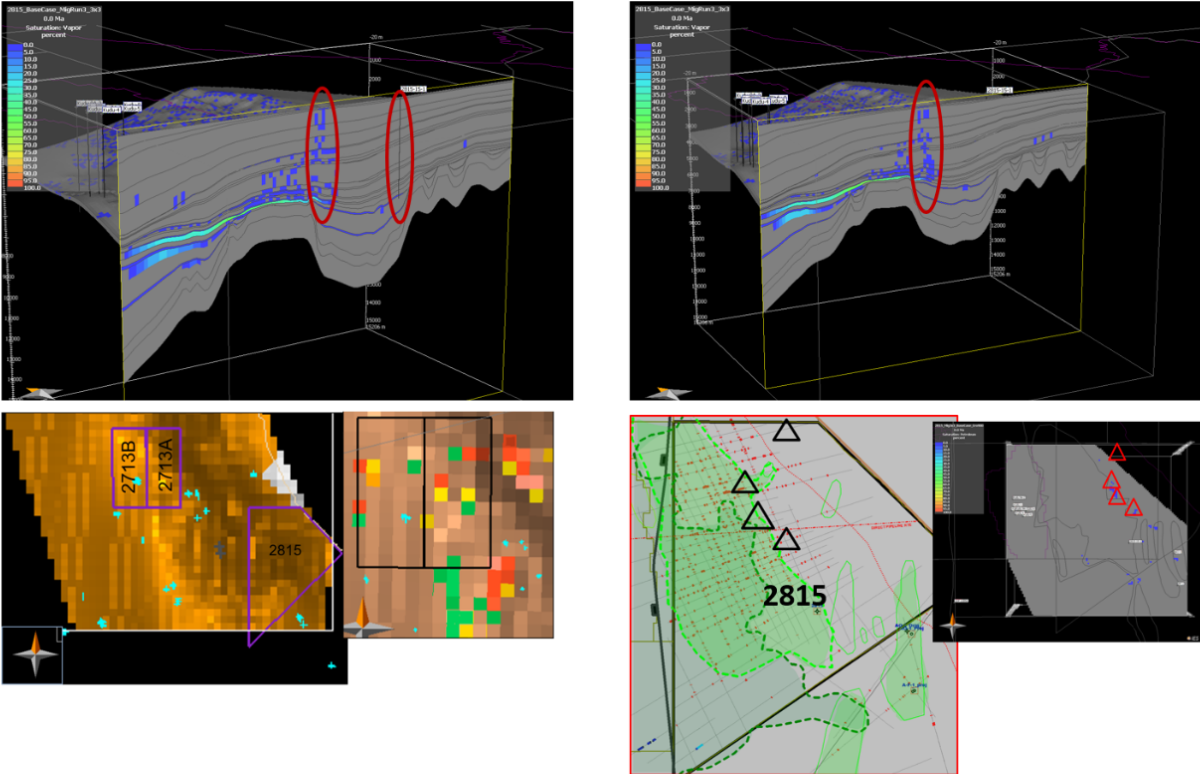
Fig. 7: Successful reproduction of gas chimneys and hydrocarbons seeps in the 3D model.
With the recent developments and new data coming in from seismic, geochemistry, and wells (including Venus and Graff, of course), the time has now come to re-enter into a PSM campaign, using both leading software packages PetroMod© (by SLB), and Trinity© (by zetaware) at the same time. This next iteration of PSM offshore Namibia will again improve our general understanding of the petroleum system in the area, and at the same time, help steer exploration decisions to be made soon. The time has come for Namibia, and we will be again at the forefront: In the quest to find more oil offshore Namibia!

Hans Axel Kemna, PhD
Hans Axel Kemna (a.k.a. ‘Hansa’) acquired a Ph.D in geosciences in 2006. Since 2008 he has been working as a freelance consultant performing Petroleum Systems Analysis projects for a wide variety of clients worldwide. His expertise on petroleum systems in Brazil is well-known throughout the industry. In fact, a large portion of the studies in the BPS portfolio were completed by him. Hansa is also responsible for technical and sales support in the European market.
