We continue to present powerful new advanced geochemical techniques in our “A Petroleum Scientist’s Best Friend” series.
In Vol. I, we depicted Quantitative Diamondoid Analysis (QDA), which has revolutionized the ability to estimate oil cracking and identify complex oils derived from multiple sources charged from different depo-pods. Application of this method to oils in the Santos Basin has led to new insights into oil sourcing, migration pathways, filling histories and distribution of CO2 within the basin.
We are showcasing a powerful new technology called Compound Specific Isotope Analysis of Biomarkers (CSIA-B).
Most organic geochemists have probably dreamed about the possibility of determining the isotopic signature of individual biomarkers in oils. Because biomarkers provide vast amounts of information with regard to oil source organisms, depositional environments and age, making them extremely useful for oil correlations, one can imagine how much more powerful this technique would be if the isotopic signature of each biomarker could be determined. However, with the exception of a few oils and extracts with unusually high biomarker concentrations, this dream has proven impossible because biomarkers exist in very low concentrations (ppms) in very complex oil mixtures (hundreds of thousands of components). Recently, we have been able to solve this needle-in-the-haystack problem and isolate biomarkers from practically any oil that contains them, allowing for their isotopic signatures to be determined using gas chromatography-isotope ratio mass spectrometry (GC-IRMS). In doing so, a whole new world of biomarker isotopes has emerged, CSIA-B. And as expected, the results are extremely interesting, providing previously unobtainable data and multiplying the power of oil correlations many times over.
We know that the biomarkers we see in petroleum like steranes and hopanes are derived from specific organisms living in specific depositional environments. We also know that the carbon isotopic signatures of biomarkers are determined by the organisms which synthesize them, i.e. are fixing carbon. Furthermore, isotopically speaking, “you are what you eat plus a couple per mil”. Because the carbon that is available for the organisms to fix or consume is determined by many factors related to the depositional environment and the niche of the organism within said environment, biomarker isotopes provide a wealth of information that can be employed for a variety uses, some of which we will describe here.
A geochemist can look at an m/z 191 mass chromatogram and draw some very important conclusions. For instance, one can observe that C29 hopane is less abundant than C30, the oil has intermediate amounts of gammacerane, and that there is some oleanane present. From this information, one can then derive useful insights about the depositional environment and age of the source rock. Taking things further, they can also use statistical analyses (chemometrics) such as hierarchical cluster analysis (HCA) and principal component analyses (PCA) of biomarker ratios to group oils with similar biomarker characteristics into genetic families.
And up to now, that is generally what has been done (whether it was done by you, by someone in a publication you read or someone you bought a study from). And because this has been done for 20 or 30 years now, we all probably have pretty much arrived at the same conclusions for most of the basins in the world, especially the most prolific ones.
As a result, we are “stuck in a rut” with regard to the tried and true geochemical methods we have been employing for so many years. In order to add real value, we need to look at a basin in new ways using new techniques, and CSIA-B is one such technique. For instance, one might have two m/z 191 chromatograms that are almost identical both visually and statistically. However, CSIA-B might reveal that the isotopic signature of C29 hopane in one sample is -50 per mil and that the other is -20 per mil. Obviously, these oils no longer correlate, leading to new ideas about sourcing, and perhaps resulting in new basin models and new plays. Actual examples from the Brazilian Margin are described below.
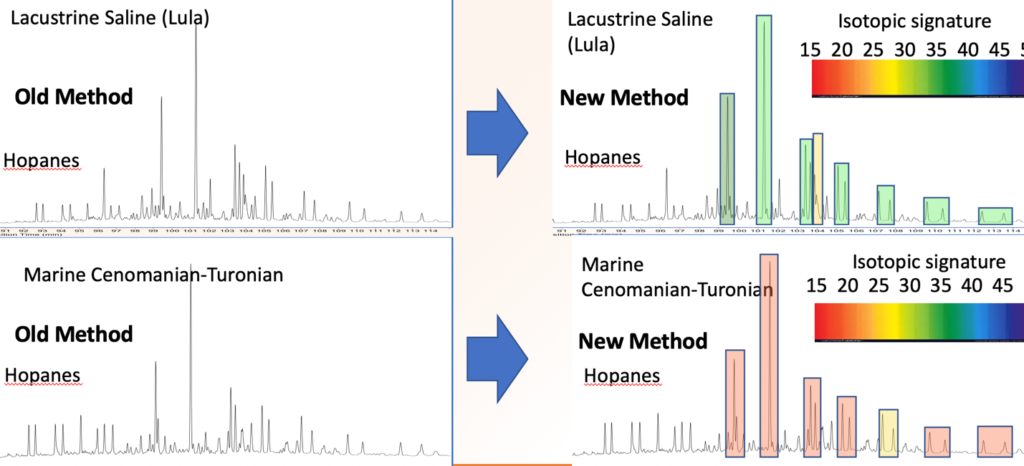
To get an idea of the power of this method and the ease with which it can be employed, look below at Figure 1, which shows two roughly similar m/z 191 mass chromatograms. The chromatogram at the top is an oil from Lula, and the one on the bottom is a typical marine-derived oil from South Santos. On the right side of the figure, the two chromatograms are colored based on biomarker isotopic values. Here one can see that by including the isotopic data, it becomes very clear that the two oils are drastically different. And, in a sense, one can think of the isotopic values as adding color to chromatograms.
Just as there is dramatically more information in a color photograph than there is in a black and white one, a chromatogram that is colored with isotopic values has dramatically more information than one without. Although an experienced geochemist could tell the two oils apart based on the chromatograms alone, there are other examples in which the chromatograms are virtually identical but the isotopes of individual biomarkers, the CSIA-B, are very different. Furthermore, one does not have to be a geochemist to tell that the two chromatograms showing biomarker isotopes are different. Basin modelers, the head of the business unit, and even the CEO of the company could easily tell that the oils are from different genetic families based on the “isotopically colored” chromatograms. And as I am sure most geochemists are aware; it is often convincing management of the value of oil geochemistry that ultimately determines its usefulness.
We have seen in many of the studies we have done, including those of oils from the Brazilian Margin, the application of CSIA-B reveals these mixtures. For example, observe the two oils in Figure 1 and imagine that there is another oil that is a mixture of the lacustrine and marine sources for which these samples are end members. Let us say that the mixed source oil is 75% marine and 25% lacustrine. Because the chromatograms of the two sources are similar and the marine source is dominant, we may find that the lacustrine source is completely overlooked by our statistical analysis. However, determination of the isotopes of the biomarkers will obviously reveal that the oils are a mixture.
This would also apply to mixtures where one oil is more mature than the other, and as a result, has lower biomarker concentrations. This seems to be quite common in the Brazilian Margin, where biomarkers of a less-mature marine component in the mixture overprint the biomarkers from a larger but more mature and, hence, biomarker-poor lacustrine component. However, because the isotopes of the biomarkers are more sensitive than the ratios, these mixtures can be recognized. Examples are shown in Figures 2 and 3 below.
In order to recognize oil mixing, we must have end members from each source rock. Using these end members, we have recognized mixing in virtually all the Brazilian basins, including the mixed marine and lacustrine in the Southern Santos, Sergipe, Potiguar and Ceará basins, and lacustrine brackish and saline to hypersaline end-member mixes in the Pre-Salt Santos, Sergipe-Alagoas, Potiguar and Ceará basins. Below is a graphic showing the hopane isotopic end members and selected mixes from the Brazilian Margin.
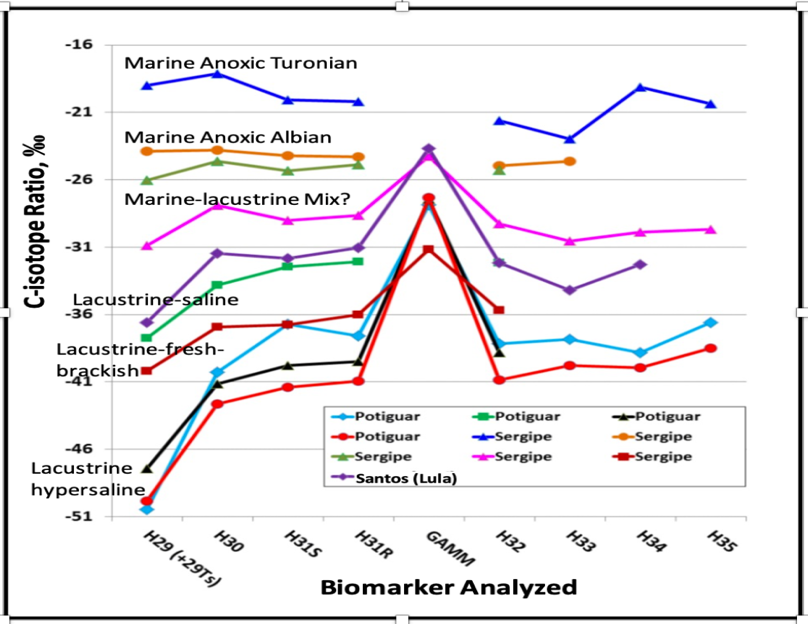
Analyzing a large number of deep and ultra-deep offshore oils from Santos, Campos, Sergipe, Ceará, Potiguar and Equatorial basins, BTI/BPS encountered this range of values for hopanes from various oils ranging from marine anoxic to lacustrine fresh/ brackish/saline and hypersaline (Figure 1). Also, and most importantly, when integrated with diamondoids (QDA/QEDA), the suite of CSIA-Bh data has shown that oil mixtures in the majority of Brazilian oil fields, from Santos up to the Equatorial Margin, are not an exception, but a common fact.
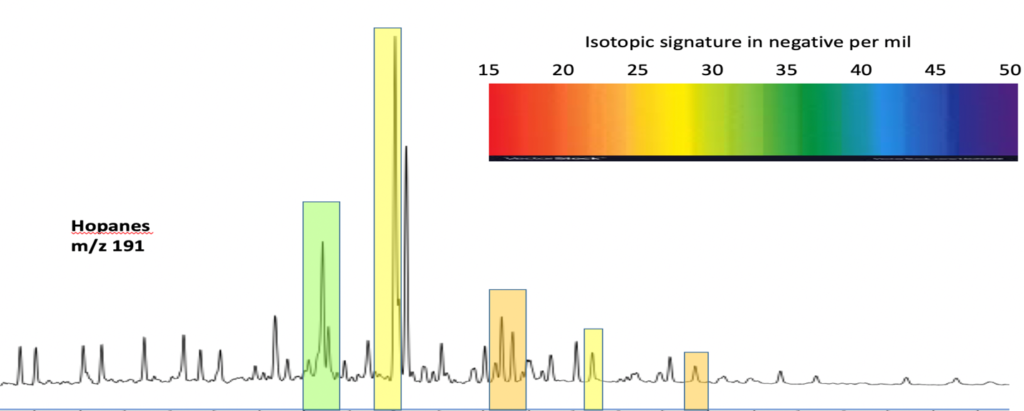
Because field sizes in the Brazilian Margin are related to source, it is extremely important to recognize even small contributions from the most prolific source rocks. Figure 3 below shows an example from the giant Barra field condensate from the ultra-deep waters of the Sergipe Basin. This oil has been correlated by m/z 191 biomarker mass chromatograms to the Albian-Cenomanian to Turonian marine source, in part, based on the very high abundance of oleanane. However, using CSIA-D, it can be observed that the d13Cisotopic signature for C29 hopane is –30.78‰, indicating that it is lacustrine derived. This shows that the condensate is actually a mixture of non-cracked Albian-Cenomanian marine black oil containing oleanane with highly-cracked (although some C29 hopane has obviously survived) Aptian to Barremian lacustrine condensates/gas from a very deep lacustrine source rock pod. As such, identification of mixtures and estimates of relative contributions using CSIA-B/QDA can drastically change petroleum basin modeling outputs and provide an entirely new view of even the most highly explored basin. Obviously, in this case, the presence of the prolific Aptian-Barremian lacustrine source considerably raises the potential for large fields in the basin.
The exploration implications of these new technologies applied in ultra-deep waters of Santos, Campos, Espírito Santo, Sergipe-Alagoas, Ceará-Potiguar and the Equatorial Margin basins are immense. This is true because they can confirm the presence of prolific sources in exploration frontiers that have not yet been drilled and where one was not previously known to exist. These AGT analyses provide the means to identify, characterize and deconvolute the basins’ putative source-rock systems using only oil samples. Also, they can disentangle complex oil mixtures that are composed of black oil and highly-cracked condensate from very deep source-rock horizons and predict their paleo-environmental organic facies.
Using CSIA-B to do Basic Science (Having lots of fun!) While Doing Correlations
In addition to being an extremely powerful tool for doing definitive oil correlations and deconvoluting mixed oil sources, CSIA-B also reveals fascinating insights into biomarker origins that were previously unobtainable. For instance, in Figures 1 and 2, it can be observed that not only is the C29 hopane highly isotopically negative in the lacustrine oils (between -35 and -50 per mil), it is isotopically different, i.e. lighter than all the other hopanes in the same sample. This might suggest that there are abundant bacteria that are synthesizing molecular precursors to C29 hopane that are probably consuming isotopically light methane and that there are fewer bacterial precursors to the other hopanes derived from methanotrophs.
It can be also be observed in Figures 1 and 2 that the gammacerane isotopic value is considerably more positive than the hopanes (up to 10 per mil). Gammacerane is believed to be from bactiverous ciliates and is particularly abundant in stratified water columns. Based on the isotopic values and remembering that “you are what you eat plus a couple per mil”, if gammacerane is from bactiverous ciliates, those ciliates are not eating the bacteria responsible for the isotopically negative hopanes. The question then becomes: if gammacerane is indeed from bactiverous ciliates, what bacteria are these ciliates eating? Alternatively, perhaps there is another source for gammacerane.
Another interesting point is that in some oils, like the marine oils shown above in Figures 1 and 2, all of the hopanes have relatively similar isotopic signatures. In fact, in many oils, almost all the biomarkers including steranes, hopanes and tricyclic terpanes have relatively similar isotopic values. In other oils, there is considerable variation from compound to compound. Perhaps the two different oil types are due to the amount of carbon recycling due to various factors related to redox conditions, including basin shape, water depth and the rate and amount of primary productivity.
So far, we have shown only the hopanes isotopes. With the CSIA-B technique one can also look at other biomarker compound classes, including n-alkanes, steranes and tricyclic terpanes. Here one can also answer various questions that were unanswerable before the invention of the technique. For instance, one might ask, “is it possible to see differences in the C29 sterane isotopes and the C27 and C28 isotopes in an oil believed to be partly derived from terrestrial organic matter? Is oleanane different isotopically than biomarkers derived from marine algae? In addition, biomarker isotopes also allow one to look for isotopic effects on biomarkers due to algal blooms in which biomarker isotopic ratios might be affected by organisms fixing carbon in a carbon-limited environment. For instance, one might hypothesize that dinosterane would have a more positive isotopic signature than the other steranes due to the fact the dinoflagellate blooms are fairly common, e.g. the red tide.
It is also very valuable to examine the differences between the isotopic signatures of the primary producers generally at the top of the water column and compare those with the signatures of bacteria, many of which are scavengers living below the photic zone, and even the water-sediment interface. Along these lines, differences in sterane and hopane isotopes have been shown to be important for oil correlations in the Brazilian Margin as well as other areas around the world.
In summary, information about the paleo-environment and the paleo-biota, which was impossible to obtain previously, can now be obtained analyzing only oil samples. As a result, not only are CSIA-B studies extremely useful for oil correlations and recognizing and deconvoluting mixed-source oils, they also tell us much about the biota, biomarker precursors and depositional environment that was far beyond the scope of any previous technique. Finally, looking at results derived isotopes of biomarkers never fails to stimulate the mind in terms of trying to understand why the isotopic values are what they are for each individual biomarker. These factors combine to truly make CSIA-B a “geochemist’s best friend”.
