We are excited to announce we have now integrated GOR and CO2 maps into the platform, fluid properties that are essential to understanding exploration potential in offshore Brazil. When integrated with our massive geochemical and reservoir datasets, they become a key tool in validating petroleum system evaluations and O&G expectations, especially in the areas where the diamondoid analyses point to migration pathways of black oils mixed with highly cracked oils.
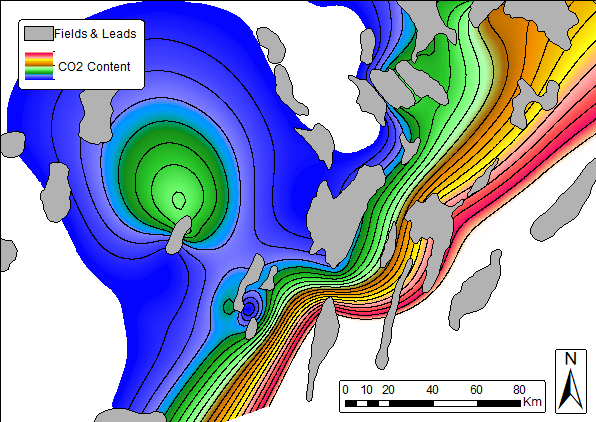
GOR and CO2 content were analyzed via correlations in our extensive dataset of PVT properties. The results from our careful analysis of production fields were also merged with the PVT results in order to define domains with different GOR and CO2 content levels across the areas where oil is the primary production fluid and solution gas is secondary. Production over time, represented by the oil production and solution gas rates, was filtered for the first months to avoid the use of GOR after an extended period of production, when pressure is expected to decrease below the bubble point. The values obtained from more than 70 PVT samples from geochemical analyzes, which were merged with those obtained from field production rates, formed a dataset of more than 300 GOR values and almost 100 CO2 sample data. The areal distribution can be easily observed along the study areas in the regional GOR and CO2 maps of most of Brazil and the Santos and Campos basins in Figures 1 and 2, respectively.
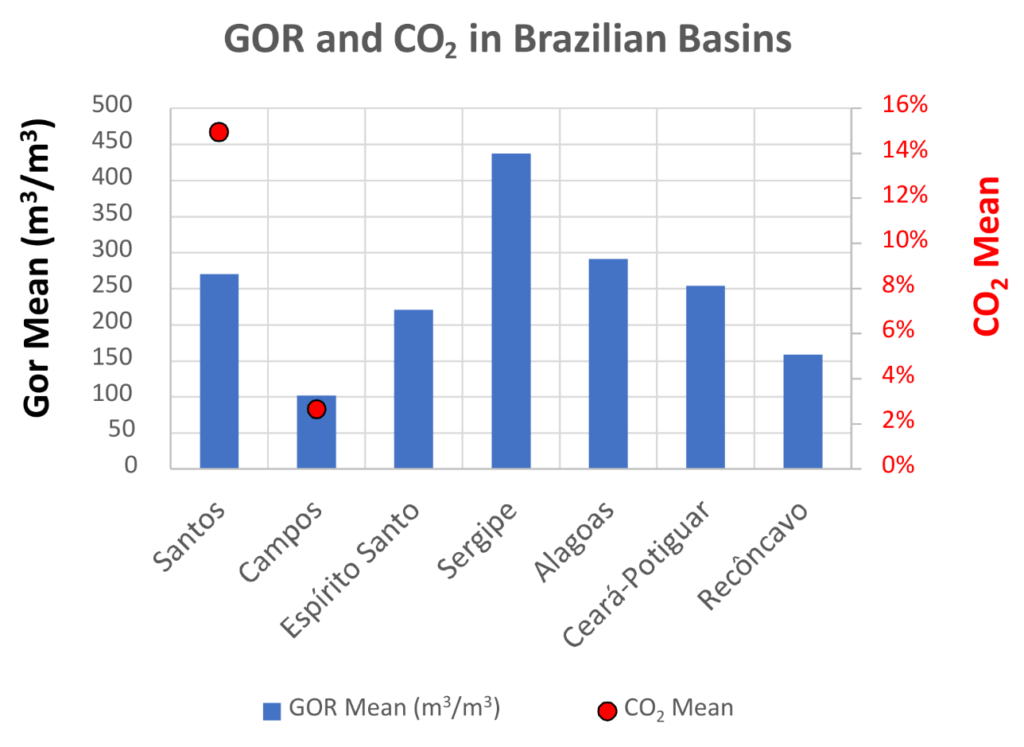
In the same way, we have also analyzed and charted CO2 across the Santos and Campos basins to provide estimates of hydrocarbon and CO2 joint occurrence, which is fundamental for exploration and production in the pre-salt area. Considering that the most accurate method is PVT analysis, the CO2 values were filtered and interpolated to create a CO2 distribution map of the basins that is available to subscribers in the BPS Geodatabase. With the same BPS datasets, hundreds of values were treated statistically to compare the distribution in selected basins (Figure 3), showing that anomalous CO2 values are found mostly in the Santos and Campos basins and that the average GOR values are in line with peak oil, with the exception of the Sergipe-Alagoas and Santos basins, which present higher average values (only slightly in Alagoas).
The integration of the geological, geochemical and PVT data appears to suggest that the cracked component in the oils in the Santos and Campos basins and the CO2 are migrating along the same routes from the ultra-deep waters southeast of the accumulations. It may be possible that both the maturity and CO2 risks could be mitigated by finding shallower source kitchens in the ultra-deep waters. This study is part of our major multidisciplinary project aimed at fully understanding the migration pathways of the CO2 component in the oil habitat of the Santos Basin.