In this article, we take a deeper dive into High-Resolution Geochemistry While Drilling (HRGWD), a revolutionary new technology offered by Optimum that aims to detect, collect and analyze potential oils, condensates and gases from reservoir sections drilled by wells in a timely manner using organic extraction (Soxhlet) of plugs, cuttings and/or core reservoir samples. Check it out below to see how this revolutionary new technology can optimize costs and support on-site decision making while drilling future wells.
Examples of HRGWD in action!
Figures 1 and 2 illustrate examples of the results of HRGTWD in two well sections from the post-salt Campos and onshore Solimoes basins, respectively. As can be noted, in the post-salt Campos Basin, two oil bearing intervals were detected during drilling, an upper one composed of severely biodegraded oil (estimated around 10-12 degree API; see Figure 3 below), and a deeper one presenting higher hydrocarbon concentration, where a bimodal n-alkane fingerprint is noted, suggesting oil mixing.
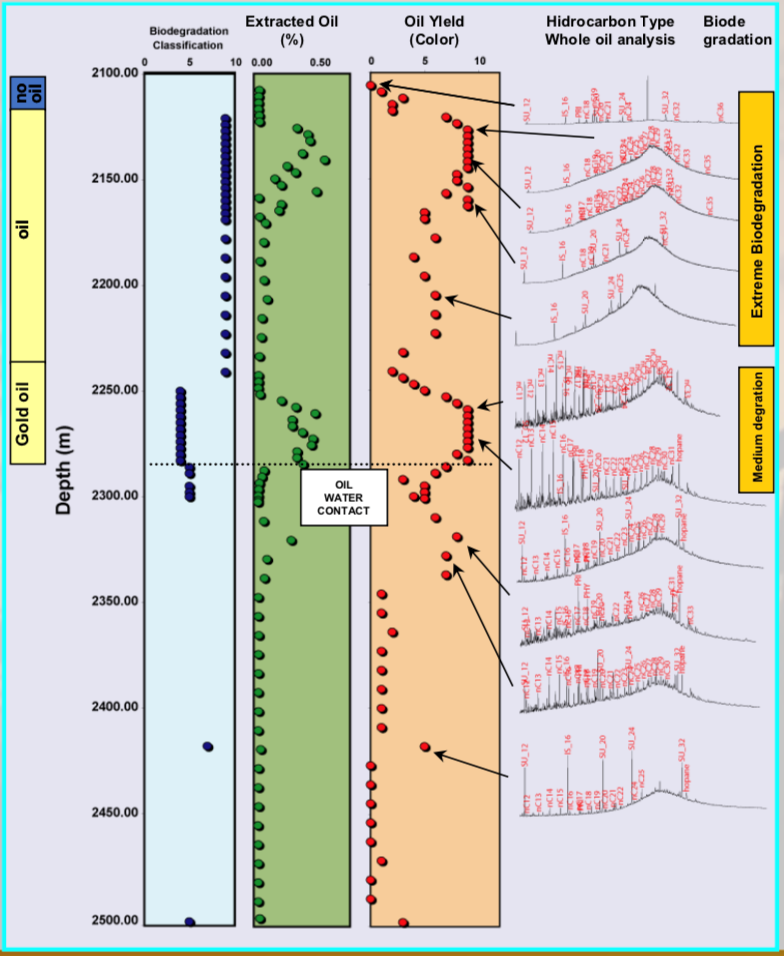
These oil extracts present traces of 25-norhopane peaks with m/z 177 transitions (not shown here) indicating there was initially a high level of biodegradation in the first charge to the reservoir, followed by non-biodegraded oil charge(s). Although the level of extended 25-norhopanes is trace, the data are reliable and have important implications regarding oil quality. The process indicates that the oil is a mixture derived from either the same or different source-rock systems, suggesting a mixture of at least two migration pulses. In summary, the deeper oil extracts (e.g., below 2,250 meters) are mildly biodegraded (e.g., around 19–21 degree API) and present oil-water contact at around 2,280–2,285 meters. The GC trace also suggests generation close to the peak oil window for the last emplaced oil.
On the other hand, in the Paleozoic reservoir section of the Solimoes Basin, depicted in Figure 2, all the oil-bearing reservoir intervals detected by HRGWD presented very high hydrocarbon concentrations. The GC and GC-MS data indicate n-alkane and biomarker fingerprints diagnostic of an endmember, marine-derived oil sourced from a typical Paleozoic Frasnian source-rock system. It is important to note that, although separated by salt layers, all the oils show identical biomarker data. In addition, and most importantly from an exploratory point of view, the sterane maturity data indicate all samples to be at an early stage of maturity typical of an undercharged source-rock system.
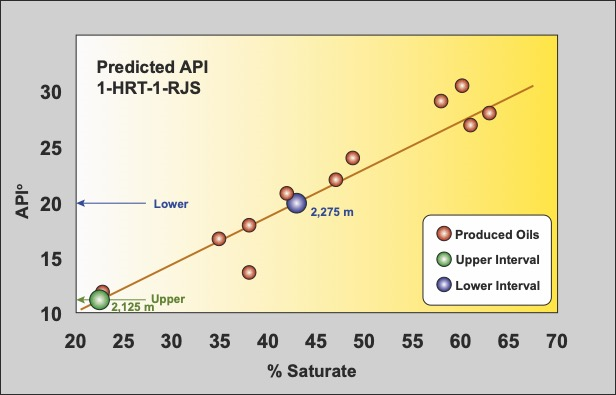
To enhance the accuracy of the results, correlation with analyses of produced oils/condensates from oil accumulations/fields near the drilling area allows the construction of calibration curves based on measured oil properties versus GC and biomarker ratios. Once suitable calibration curves have been constructed, oil properties can be indirectly determined throughout an entire well via gravimetric, viscosity, elemental, carbon isotope, GC, GC-MS or GC-MS-MS data. An example is shown in Figure 3, where very reliable API values can be ascertained for all extract data taken in the well depicted in Figure 1.
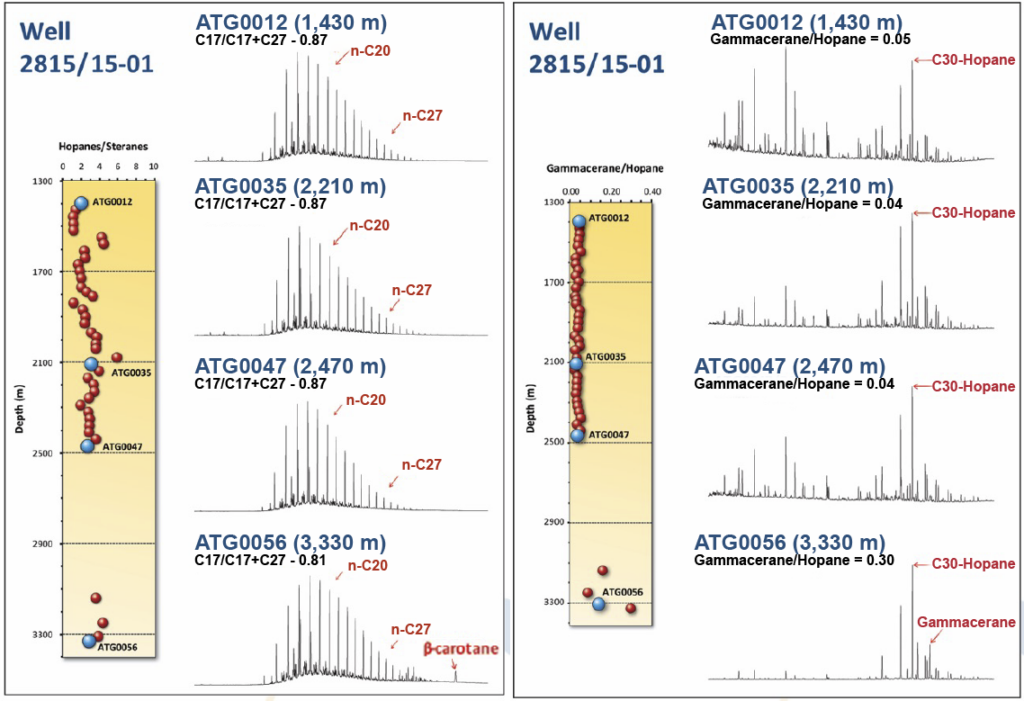
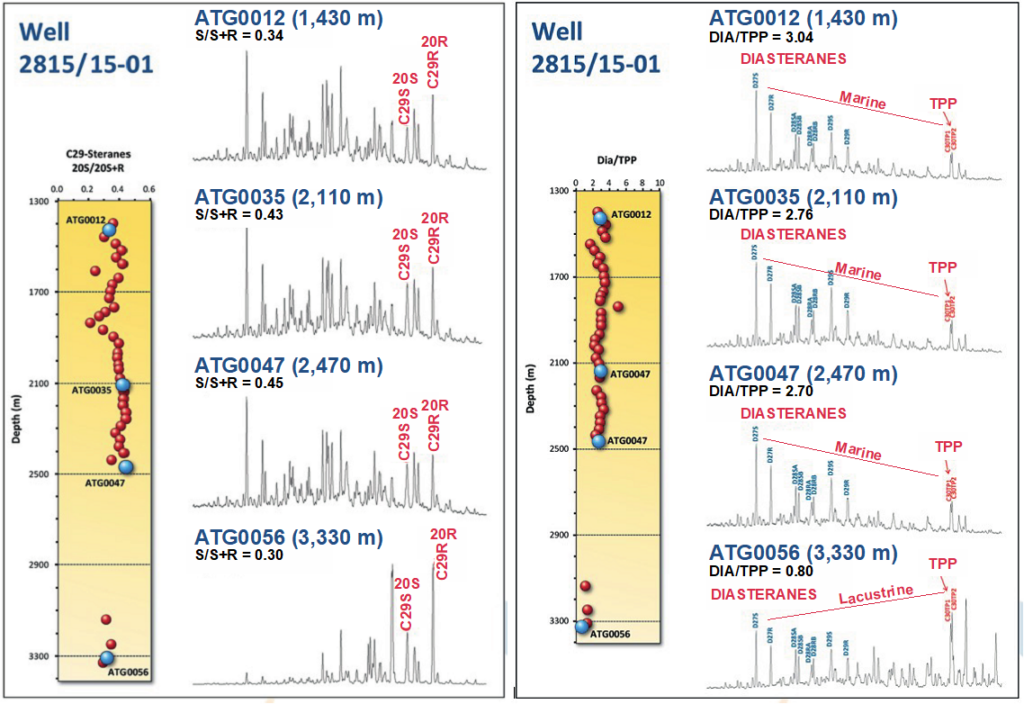
Figures 4 and 5 show selected GC and GC-MS profiles and biomarker ratios (e.g., hopane/sterane, gammacerane index, C29 sterane maturity and C27 diasterane/TPP ratios) of the extracts taken as examples representing all samples from 1,430 to 3,330 meters from well 2815/15-1 in Namibia. As can be observed in Figure 4, the samples from 1,430 to 2,470 meters show GC trace distributions typical of a marine (e.g., low hopane and gammacerane concentrations), thermally mature, non-biodegraded oil with dominance of low molecular weight n-alkanes, suggesting a medium to high thermal evolution stage despite the loss of low molecular n-alkanes in the extraction. In contrast, the samples at 3,300 meters show GC and GC-MS trace distributions that suggest a lacustrine (e.g., higher hopane and gammacerane concentrations), non-biodegraded, thermally mature saline oil. The presence of B-carotane in the deeper samples’ GC fingerprints corroborates such interpretation, as this compound is found in several lacustrine brackish to saline oils that occur in the Southern South Atlantic basins.
The analyses and distribution of terpane biomarkers (e.g., Fig. 4) show a very uniform Albian-Cenomanian marine dataset for all extracts up to 2,500 meters, with completely distinct biomarker data for the Aptian to Neocomian lacustrine saline oils from the deeper samples below 3,300 meters. As can be noted in the m/z 259 mass fragmentogram in Figure 5, this oil presents a much lower diasterane/TPP ratio compared to the upper samples classified as marine.
Holba et al. (2000) shows that TPP is an effective biomarker for the discrimination of lacustrine and marine environments. The TPP ratio plotted in Figure 5 was determined from the GC-MS sum of the peak areas of the C26 27-norcholestanes/C30 TPP (lacustrine deposition marker). TPP ratio has revealed great specificity in identifying lacustrine inputs in crude oils because it is a direct indication of non-marine algal input. Additionally, the marine oils (shallower samples) present tricyclic terpane and sterane ratios (e.g., Fig. 5) that confirm their marine origin (e.g., low gammacerane, low hopane/sterane and Diasteranes/TPP > 1), along with a medium to high thermal evolution stage (e.g., C29 sterane maturity parameter).
These data classify the samples as mostly at pre-peak to peak generation stages of thermal evolution. In contrast, the samples close to 3,000 meters show tricyclic and sterane thermal maturity data typical of early/mid maturity oils (e.g., Figs. 4-5). These data could suggest long-distance migration from a deeper marine pod for the upper samples of the well, along with a short vertical migration pathway for the deeper lacustrine oil extracts. Advanced geochemical data (not shown here) indicated the deeper oil extract to be a mixture of lacustrine and marine oils. The GC fingerprint of this extract also provides strong evidence that the source-rock systems in the area attained peak oil generation stage.
After describing the molecular features of each of the analyzed extracts, the geochemical and biomarker data can be integrated with quantitative diamondoid (QDA), CSIA-Alkanes, CSIA-B, CSIA-D and quantitative extended diamondoid (QEDA) analyses to elucidate questions related to thermal evolution, organic facies, oil provenance and mixing. This integration is key to disentangling complex mixtures involving facies variation and highly mature cracked oil, oil paleo-biodegradation, migration distance and evaporative fractionation volumetrics, among others.
GEOCHEMICAL LOGGING
Where conventional logging techniques do not provide definitive identification of oil/condensate/gas/water contact and oil/condensate quality, geochemical logging can be used. An example is illustrated in the article on geochemical recognition of oil-water contact in the Niger Delta by Baskin et al. in AAPG, Vol. 79 (1995). The work uses the same types of extracts described here. By calibrating GC fingerprints of cuttings and core extracts to zones of known oil, water and gas legs, these diagnostic fingerprints could be applied to determine oil-water and gas-oil contact in wells where contact could not be located by any other means.
Not only is geochemical logging an important method for determining oil properties for reservoir continuity studies and recognition of oil-water contact, but it can also be used to define pay zones and rank oil/condensate quality.
Along with providing distinctive geochemical fingerprints, each extract also carries information concerning the amount of oil/condensates/gas contained within a particular sedimentary section (i.e., oil/condensate saturation). This is done based on quantitative analysis of ubiquitous molecular species found in petroleum as well as the richness of the color of the extract. Where n-alkane, carbon isotope and biomarker (e.g., terpanes) concentrations are high and extract color is dark, oil/condensate saturation is high. However, high oil/condensate saturation does not necessarily mean that the hydrocarbons will be producible. These data must be combined with other oil characteristics from HRGWD and High-Resolution Geochemistry Gas-Tech Mud Isotope Logging (HRGGTMIL) logs, as well as porosity and permeability derived from conventional well logging.
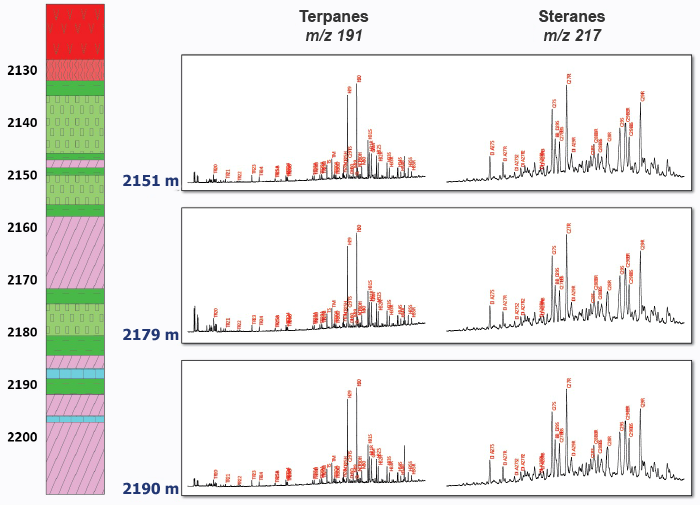
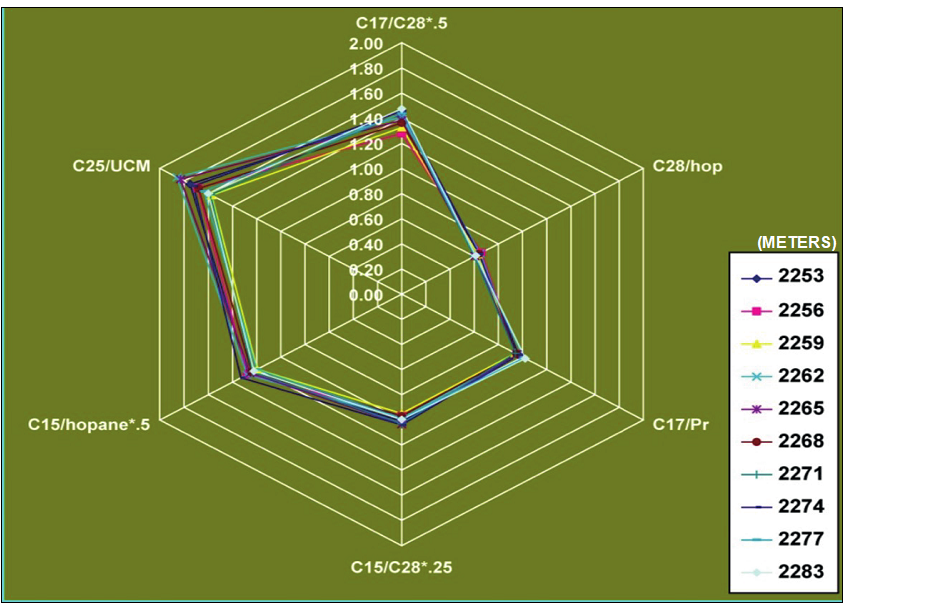
The diagram in Figure 6 illustrates the use of oil composition, GC and GC-MS biomarker ratio data from organic extracts taken from plugs from a reservoir section. Observe how the data can disentangle reservoir fluid composition throughout the entire analyzed section, suggesting identical hydrocarbon composition. In addition, the use of such diagrams can also define oil type, oil mixing and even reservoir compartmentalization in the analyzed samples from 2,253 to 2,283 meters.
ADVANTAGES OF AGT
Quantitative diamondoid (QDA), compound specific isotope of biomarker (CSIA-B) and quantitative extended diamondoid (QEDA) analyses can also be applied to the extracts, aiming to identify and characterize oil origin, thermal evolution, cracking and oil mixtures as well as oil types. These data contribute additional valuable information missed by all the other routine analyses (Figures 4-9).Figure 7 shows quantitative diamondoid analysis data (QDA) of several fluid extract samples ranging from 4,443-4,593 meters from a pre-salt reservoir section of a well drilled in the Santos Basin.Quantitative diamondoid analysis (QDA) is used to determine the thermal maturity and estimate the amount of liquid to gas cracking any sample has undergone. In addition, QDA is the only method that can be used to recognize mixtures of low and high maturity oils. It can also be used to show fractionation due to migration and evaporative fractionation in the reservoir. As can be noted in the example in Figure 6, the sterane/diamondoid concentration data (ppm) suggest the presence of oil mixing (in the entire analyzed section) of uncracked black oil with highly cracked condensates that have migrated from very deep depopods in the basin.
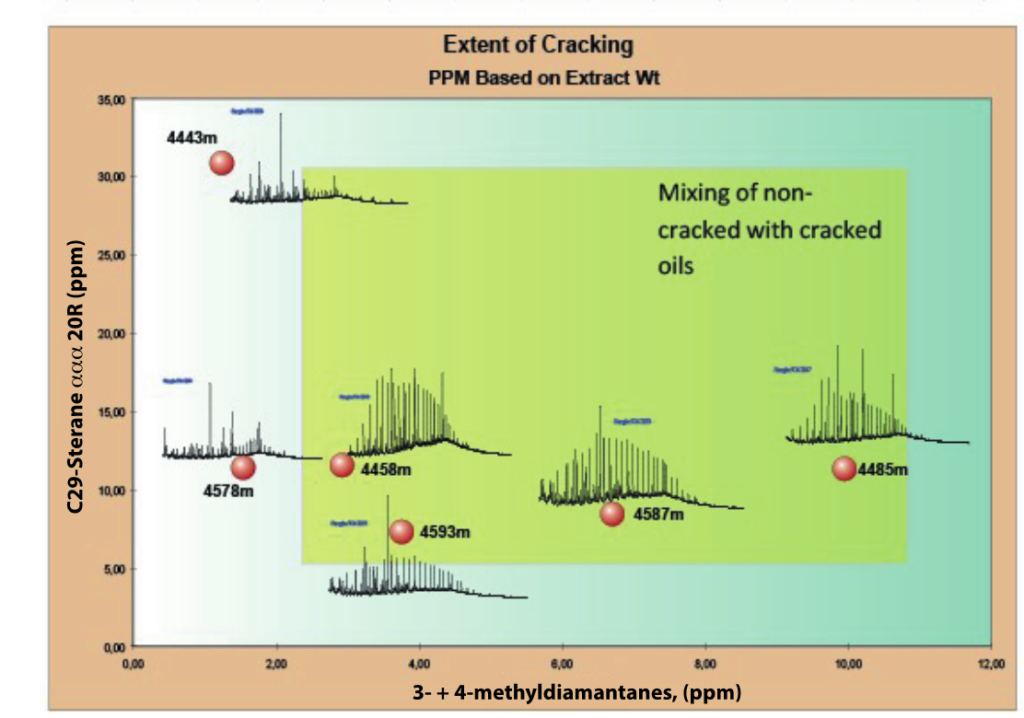
Figure 7 displays the results of QDA analyses performed on the six selected oil extract samples. Two oil extracts present 3- + 4-methyldiamantanes concentrations below 2.5 ppm (e.g., samples at 4,443 and 4,578 meters) and are therefore non-cracked black oils. Such value would correspond to a %Ro equivalent of around 0.7-0.8% (cf., calculated using the formula in Dahl et al., 1999). In contrast, the four other oil extracts present 3- + 4-methyldiamantanes concentrations above 3.0 ppm and are therefore considered of mixed maturity, with their calculated %Ro equivalent values potentially relating only to the cracked parts of the oils. This is because the %Ro equivalent value of the black non-cracked part of the oil is only around 0.7% to 0.8% Ro (e.g., early to close to peak maturity stage of generation). The oil extracts that presented values of 3- + 4-methyldiamantanes above the baseline (e.g., around 2.5 ppm) are partially cracked (QDA ranging from 2.5–4.0 ppm) to highly-cracked (QDA ranging from 5.0–10 ppm).
Using the formula in Dahl et al. (1999), their degree of cracking can be calculated. The partially cracked oil extracts (e.g., samples at 4,458 and 4,593 meters) would then calculate to be around 15% to 35% cracked, which corresponds to a %Ro ranging from 1.3% to 1.5% (cf., Mello et al., 2021). On the other hand, the oil extract samples from 4,485 and 4,587 meters are calculated to be over 50% cracked, corresponding to %Ro equivalent values above 1.7%. It is important to mention that such values potentially relate only to the highly cracked parts of the oil extracts. Using only the GC and GCMS biomarker data, all the extracted oils in the reservoir section between 4,443 and 4,593 meters would show similar thermal maturity, probably ascertained from the same generation depopod inside the oil window.The conclusion that these oil extracts are mixtures containing minor parts of non-cracked oil (e.g., generated at an early stage of maturity) is important to better understand the charge system in the reservoir. In contrast, the highly cracked oil extracts, which are a major part of the oils (e.g., more than 50%), were generated at overmature levels of thermal evolution (vitrinite reflectance equivalent of around 1.7%) and must have taken a long-distance migration pathway.
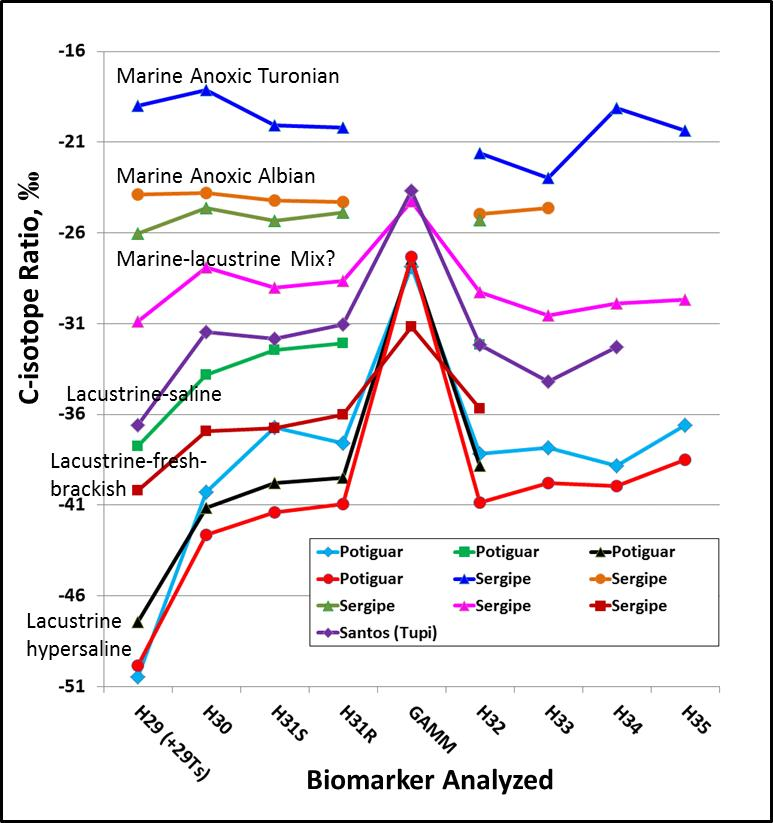
The exploratory implications of such findings is of critical importance because it suggests contributions to the mixtures from migrating high maturity oils and condensates from very deep source rock horizons, in turn suggesting an origin from a different source rock depopod than the less mature oil. When a mixed-extract oil is identified by this method, it creates a new way of looking at the reservoir fluid system processes in the reservoir section. Previously unidentified deep charges to the reservoir can be established, and the relative amount of deep versus shallow charge can be estimated. The deep source rock can be the same or different from the shallow, biomarker-containing source, or it can be a completely different source facies or formation. This can be sorted out using CSIA-B and QEDA. The extract samples can also be analyzed by compound specific isotope analyses of biomarkers (CSIA-Bh) and quantitative extended diamondoid analysis (QEDA), aiming to identify and characterize oil origin and disentangle the oil mixing components.CSIA-Bh is a unique proprietary technology used for identification of extracted oil type and depositional environment, as well as for age-related source-rock correlation for liquids of any maturity or biodegradation ranking. It can also be used to correlate source rock extracts to oils and condensates and unravel oil mixtures. No other method, except QEDA, can accomplish this (Figs. 8-9). Figure 8 illustrates that using biomarker compounds versus their carbon isotope data makes it possible to deduce the source-rock system in any petroliferous basin in Brazil (e.g., age and depositional environment) and characterize the mixing of oil extracts.
This is critical in Santos Basin oils, for example, where contributions from Barra Velha (Aptian lacustrine hypersaline), Itapema (upper Barremian lacustrine brackish to saline) and Picarras (lower Barremian lacustrine freshwater) can be present (see Figure 8). The technology applied to the same reservoir oil extracts depicted in Figure 8 could easily identify the types and ages of each of the oil extract parts in the oil mixtures present in the reservoir sections from 4,443 to 4,593 meters.
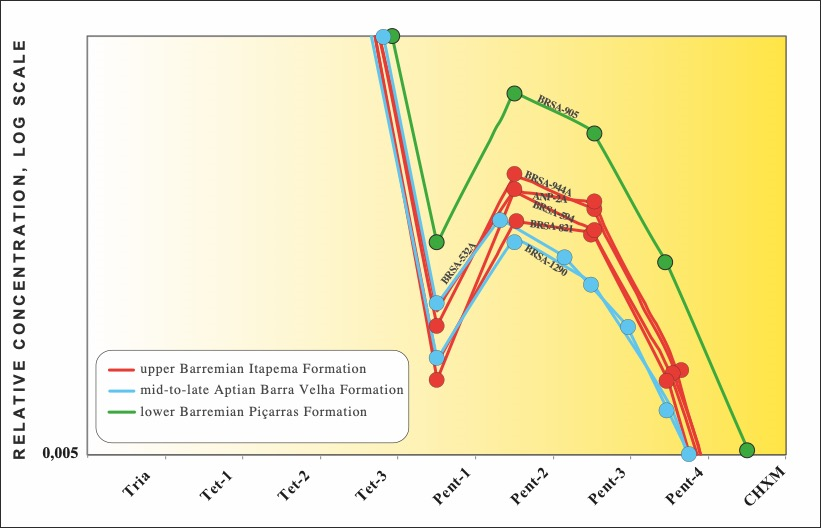
Quantitative Extended Diamondoid Analysis (QEDA) is used to determine the source rock of any hydrocarbon fluid no matter its maturity or biodegradation stage. Oils extracted from the early oil window to high-maturity condensates from the dry gas window can be correlated to each other and to the source-rock system that sourced them. It can also be used to unravel black oil/condensate mixtures by characterizing the high maturity component.Figure 9 illustrates the importance of QEDA in disentangling extracted oil types in the pre-salt section of the Santos Basin. As can be noted, there is a clear difference in QEDA data between the oils sourced from the upper Barremian rift Itapema Formation and the oils sourced from the Aptian sag Barra Velha and lower Barremian rift Piçarras formations (Figs. 8 and 9). These data can only be obtained by QEDA using fluid extracts from drilled sections.
In summary, the application of HRGWD in any exploratory or development well provides the most critical data to be obtained during drilling operations in and around the pay zone. The findings are critical to better understand and disentangle simple/complex migration and filling history where the fluid charges from variable maturities related to different source-rock facies/systems, whatever their origin. All these differences are of utmost importance before the completion of drilling and the final logging processes.It is important to emphasize that conventional geochemistry alone cannot identify, distinguish or quantify mixing in oil extracts from similar source-rock systems.
